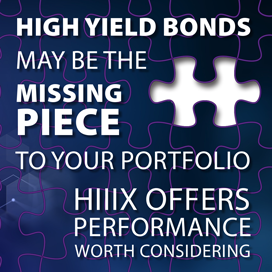
High Yield Bonds May Be the Missing Piece to Your Portfolio
HIIIX Offers Performance Worth Considering
High Yield Bonds May Be the Missing Piece to Your Portfolio
HIIIX Offers Performance Worth Considering
The High Yield Bond Difference: Just a 10% Allocation Made a Positive Impact Over the Long Term
High yield bonds are often believed to perform well in rising markets, but struggle in others. However, since 2000, adding just a 10% allocation to high yield bonds within a traditional bond portfolio led to increased returns and reduced drawdowns. In this graph-heavy article, we’ll show you how high yield bond returns have fared and introduce you to a strategy that has outperformed its Morningstar category across multiple time periods.
The following charts show the combined returns of the Bloomberg U.S. Aggregate Bond TR Index (the “Agg”) and the Bloomberg Corporate U.S. High Yield TR Index (“HY”), illustrating how adding an allocation to high yield bonds has historically benefited investors over time.
CHART 1
Allocating to High Yield Bonds Has Historically Increased Returns Over Traditional Bond Allocations
Shown as % of Bonds / % of High Yield

Source: Catalyst Capital Advisors LLC & Bloomberg L.P. Past performance is no guarantee of future results. The referenced indices are shown for general asset class and/or market comparisons and are not meant to represent any fund. You cannot invest directly in an index and unmanaged index returns do not reflect any fees, expenses or sales charges. The foregoing blended portfolios are hypothetical in nature; please refer to important disclosures at the end of this presentation regarding the inherent limitations of hypothetical performance data. The value of an investment and any income on it may go down as well as up and may vary. Income may fluctuate in accordance with market conditions and taxation arrangements.
CHART 2
More High Yield? More Positive Months Than the Agg
% of Positive Months

CHART 3
High Yield Lessened the Severity of Traditional Bond Drawdowns
Maximum Drawdown

Source: Catalyst Capital Advisors LLC & Bloomberg L.P. Based on monthly return data from 12/31/1999 to 12/31/2025. Past performance is no guarantee of future results. The foregoing blended portfolios are hypothetical in nature; please refer to important disclosures following Chart 1 and at the end of this presentation regarding the inherent limitations of hypothetical performance data and the use of the referenced indices for general asset class and/or market comparisons.
As these charts illustrate, including high yield securities in a bond portfolio has the potential over time to increase returns, positive return frequency, and reduce drawdowns.
But with many high yield options to choose from, where should investors look?
Our Strategy
The Catalyst/SMH High Income Fund (HIIIX) is a high yield bond fund that has significantly outperformed its competition over the past ten years. HIIIX implements a rigorous investment process, leading to a concentrated portfolio that seeks to generate strong returns.
HIIIX Has Historically Been Near the Top of Its Morningstar Category
Ranks in the Top 1% in 1, 3, and 10-Year Periods Ending December 31, 2025
| Quarter End as of 12/31/2025 | 1-Year | 3-Year | 5-Year | 10-Year |
|---|---|---|---|---|
| Morningstar Category | High Yield Bond | High Yield Bond | High Yield Bond | High Yield Bond |
| Investment: HIIIX | 15.98% | 13.95% | 6.75% | 9.63% |
| Category: Morningstar High Yield Bond | 8.01% | 9.25% | 4.22% | 5.56% |
| Index: Bloomberg US Aggregate Bond TR | 7.30% | 4.66% | -0.36% | 2.01% |
| HIIIX Quartile Rank in Category | 1st Quartile | 1st Quartile | 1st Quartile | 1st Quartile |
| HIIIX Percentile Rank in Category | 1 | 1 | 2 | 1 |
| # of Invest. in Category | 622 | 584 | 548 | 445 |
| HIIIX Morningstar Category Rating | – | ★★★★★ | ★★★★★ | ★★★★★ |
Source: Morningstar. Data as of 12/31/2025. Past performance is no guarantee of future results. There is no guarantee that any fund or asset class will continue to perform similarly in the future. The referenced indices are shown for general asset class and/or market comparisons and are not meant to represent any fund. You cannot invest directly in an index and unmanaged index returns do not reflect any fees, expenses or sales charges. The Morningstar Rating is based on Morningstar Risk-Adjusted Returns, using Morningstar Risk Adjusted Return % Rank for funds in a given category. Morningstar calculates ratings for the three-, five-, and 10-year periods, as well as an Overall Morningstar Rating which is based on a weighted average of the available time-period ratings. Morningstar Percentile Rankings are based on the average annual total returns of the funds in the category for the periods stated and do not include any sales charges or redemption fees. The highest (or most favorable) percentile rank is 1 and the lowest (or least favorable) percentile rank is 100. See important disclosures at the end of this presentation.
HIIIX Nearly Doubled Bloomberg High Yield Index Returns Over the Past 10 Years

Source: Catalyst Capital Advisors LLC & Bloomberg L.P. Past performance is no guarantee of future results. The referenced indices are shown for general asset class and/or market comparisons and are not meant to represent any fund. You cannot invest directly in an index and unmanaged index returns do not reflect any fees, expenses or sales charges. The value of an investment and any income on it may go down as well as up and may vary. Income may fluctuate in accordance with market conditions and taxation arrangements. See important disclosures at the end of this presentation.

Annualized if greater than a year
| Share Class/Benchmark | QTD | YTD | 1 Year | 3 Years | 5 Years | 10 Years | Since Inception* |
|---|---|---|---|---|---|---|---|
| Class I | 1.17% | 15.98% | 15.98% | 13.95% | 6.75% | 9.63% | 3.55% |
| Bloomberg US Agg TR | 1.10% | 7.30% | 7.30% | 4.66% | -0.36% | 2.01% | 2.15% |
| ML US Cash Pay HY | 1.38% | 8.63% | 8.63% | 10.05% | 4.53% | 6.45% | 5.41% |
| Class A | 1.11% | 15.72% | 15.72% | 13.67% | 6.54% | 9.40% | 4.24% |
| Class C | 0.92% | 14.85% | 14.85% | 12.79% | 5.73% | 8.56% | 3.47% |
| Class A w/Sales Charge | -3.69% | 10.22% | 10.22% | 11.84% | 5.51% | 8.87% | 3.95% |
| Bloomberg US Agg TR | 1.10% | 7.30% | 7.30% | 4.66% | -0.36% | 2.01% | 2.93% |
| ML US Cash Pay HY | 1.38% | 8.63% | 8.63% | 10.05% | 4.53% | 6.45% | 6.60% |
*Class A & C Inception: 05/21/2008, Class I Inception: 07/1/2013
There is no assurance that the Fund will achieve its investment objective.
The Fund’s maximum sales charge for Class “A” shares is 4.75%. Investments in mutual funds involve risks. Performance is historic and does not guarantee future results. Investment return and principal value will fluctuate with changing market conditions so that when redeemed, shares may be worth more or less than their original cost. Current performance may be lower or higher than the performance data quoted. To obtain the most recent month end performance information or the funds prospectus please call the fund, toll free at 1-866-447-4228. You can also obtain a prospectus at www.CatalystMF.com. Total operating expenses for the Class A, C, and I shares is 2.37%, 3.12% and 2.12%, respectively.
You cannot invest directly in an index and unmanaged index returns do not reflect any fees, expenses, or sales charges.
Past performance is not a guarantee of future results.
Investors should carefully consider the investment objectives, risks, charges and expenses of the Catalyst Funds. This and other important information about the Fund is contained in the prospectus, which can be obtained by calling 866-447-4228 or at www.CatalystMF.com. The prospectus should be read carefully before investing. The Catalyst Funds are distributed by Northern Lights Distributors, LLC, member FINRA/SIPC. Neither Catalyst Capital Advisors LLC nor SMH Capital Advisors, LLC are affiliated with Northern Lights Distributors, LLC.
Risk Considerations
Investing in the Fund carries certain risks.
The value of the Fund may decrease in response to the activities and financial prospects of an individual security or group of securities in the Fund’s portfolio. The Fund is non-diversified and may invest a greater percentage of its assets in a particular issue and may own fewer securities than other mutual funds. The Fund may be subject to substantial short-term changes. These factors may affect the value of your investment. The Fund invests in lower-quality, non-investment grade bonds, asset backed securities and convertible securities. Non-investment grade corporate bonds are those rated Baa or lower by Moody’s or BBB or lower by S&P (also known as “junk” bonds). Asset-backed securities are securities issued by trusts and special purpose entities that are backed by pools of assets, such as automobile and credit-card receivables and home equity loans, which pass through the payments on the underlying obligations to the security holders. Convertible securities are bonds or preferred stocks which are convertible into, or exchangeable for, common stocks. Lower-quality debt securities involve greater risk of default or price changes due to changes in the credit quality of the issuer. Asset Backed securities are subject to the risk that, if the issuer fails to pay interest or repay principal, the assets backing these securities may not be sufficient to support payments on the securities.
HIIIX is rated 5-stars by Morningstar based on risk-adjusted returns for the 3-year, 5-year and 10-year period ending 12/31/2025 (out of 584 funds, 548 funds and 445 funds, respectively, in the High Yield Bond category). The Fund’s Overall Morningstar rating based on risk-adjusted returns for the Overall period ending 12/31/2025 is 5-stars (out of 584 funds in the High Yield Bond category). The information contained herein: (1) is proprietary to Morningstar and/or its content providers; (2) may not be copied or distributed; and (3) is not warranted to be accurate, complete or timely. Neither Morningstar nor its content providers are responsible for any damage or losses arising from any use of this information. Past performance is no guarantee of future results.
The Morningstar Rating™ for funds, or “star rating”, is calculated for managed products (including mutual funds, variable annuity and variable life sub-accounts, exchange-traded funds, closed-end funds, and separate accounts) with at least a three-year history. Exchange-traded funds and open-ended mutual funds are considered a single population for comparative purposes. It is calculated based on a Morningstar Risk-Adjusted Return measure that accounts for variation in a managed product’s monthly excess performance, placing more emphasis on downward variations and rewarding consistent performance. The Morningstar Rating does not include any adjustment for sales loads. The top 10% of products in each product category receive 5 stars, the next 22.5% receive 4 stars, the next 35% receive 3 stars, the next 22.5% receive 2 stars, and the bottom 10% receive 1 star. The Overall Morningstar Rating for a managed product is derived from a weighted average of the performance figures associated with its three-, five-, and ten-year Morningstar Rating metrics (as applicable).
Hypothetical Performance Limitations
The various blended portfolios represent a series of differently weighted asset classes and are generally comprised of individual indices. Any such blended portfolio should be considered hypothetical in nature. You are cautioned that hypothetical portfolios have many inherent limitations, some of which are described herein. No representation is being made that any account will or is likely to achieve profits or will not be able to avoid substantial losses. In fact, frequently there are sharp differences between hypothetical performance and the actual performance results subsequently achieved by a particular portfolio of investments. One of the limitations of hypothetical portfolios is that they are generally prepared with the benefit of hindsight. In addition, the construction of a hypothetical portfolio of investments does not involve financial risk, and no hypothetical portfolio of investments can completely account for the impact of financial risk in actual trading. For example, the ability to withstand losses or to adhere to a particular trading program in spite of trading losses are material points which can also adversely affect actual trading results. There are numerous other factors related to the markets in general or the implementation of a portfolio of investments which cannot be fully accounted for in the preparation of hypothetical portfolios, all of which can adversely affect actual trading results.
Bloomberg U.S. Aggregate Bond Total Return Index: A market capitalization-weighted Index that is designed to measure the performance of the US investment grade bond market with maturities of more than one year. Bloomberg U.S. Corporate High Yield Total Return Index: Measures the USD-denominated, high yield, fixed-rate corporate bond market. Merrill Lynch US Cash Pay High Yield Index: Tracks the performance of USD-denominated below investment grade corporate debt, currently in coupon paying period, that is publicly issued in the US domestic market. Drawdown: The peak-to-trough decline of an asset or fund’s price over a certain timeframe. Sharpe Ratio: A risk-adjusted measure of a fund’s performance that indicates a fund’s return per unit of risk, defining risk as volatility (standard deviation).