The Fund invests at least 80% of its net assets in securities that constitute the NASDAQ-100 Index (“NDX”). The Fund may also invest up to 20% of its assets in futures contracts on the Cboe Volatility Index (the “VIX Index”) and/or, upon the commencement of the NASDAQ-100 Volatility Index (the “VolQ Index”), options on VIX Futures or VolQ Futures, and in cash and cash equivalents, including U.S. Treasury obligations, as a hedge against the Fund’s exposure to the NDX.
Fund Details
As of 2026-03-11T00:00:00
| Ticker | CLPFX |
| NAV | 13.69 |
| NAV Change | -0.07 |
| % NAV Change | -0.51% |
| YTD Return | -0.58% |
| Distribution Frequency | Annually |
| Ticker | CLPAX |
| NAV | 13.39 |
| NAV Change | -0.07 |
| % NAV Change | -0.52% |
| YTD Return | -0.59% |
| Distribution Frequency | Annually |
| Ticker | CLPCX |
| NAV | 11.97 |
| NAV Change | 0 |
| % NAV Change | 0.00% |
| YTD Return | -1.48% |
| Distribution Frequency | Annually |
Fund Documents
Supplemental Documents
Financial Professional Documents
Fund Objective
The Fund’s objective is long-term capital appreciation.
Fund Highlights
The Fund complements NASDAQ-100 Index securities with a distinct volatility hedge overlay that utilizes the same methodology as Equity Armor Investments VOL 365 Strategy.
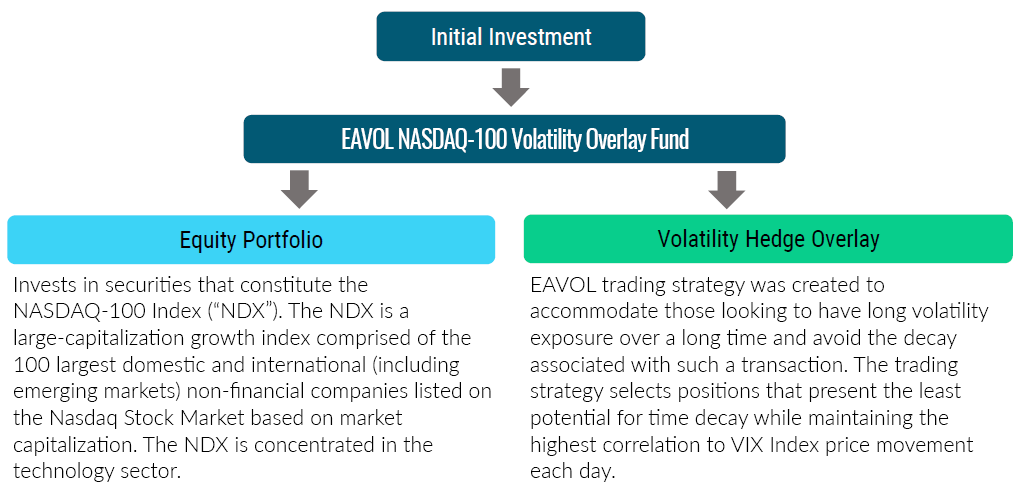
Investment Strategy
The Fund invests in VIX Futures utilizing the same methodology as the Equity Armor Investments VOL 365 (“EAVOL trading strategy”), a strategy based on a proprietary VIX futures trading strategy that seeks to correlate to VIX futures returns. The EAVOL trading strategy is constructed pursuant to a rules-based volatility analysis that identifies investments that present the least potential for time decay (i.e., the decline in the value of a contract over the passage of time), while maintaining the highest correlation to VIX Index price movement each day.
The volatility overlay aims to minimize possible losses that are common in stock indexes so that investors might be able to ride-out market swings in pursuit of their long-term investment objectives.
Fund Management

Brian Stutland
- Managing Partner, CIO, and CCO of Equity Armor since 2011
- BS and MS in Engineering, University of Michigan

Luke Rahbari
- Member and Portfolio Manager of Equity Armor since 2011
- BBA from Eastern Michigan University and MBA from University of Chicago

Joseph Tigay
- Chief Trading Officer and Portfolio Manager of Equity Armor since 2011
- BS in Economics, Michigan State University
Investment Advisor: Catalyst Capital Advisors, LLC
Sub-Advisor: Equity Armor Investments, LLC
Brian Stutland | Lead Portfolio Manager
- Managing Partner, CIO, and CCO of Equity Armor since 2011
- BS and MS in Engineering, University of Michigan
Luke Rahbari | Portfolio Manager
- Member and Portfolio Manager of Equity Armor since 2011
- BBA from Eastern Michigan University and MBA from University of Chicago
Joseph Tigay | Lead Portfolio Manager
- Chief Trading Officer and Portfolio Manager of Equity Armor since 2011
- BS in Economics, Michigan State University
Fund Overview
| Ticker | CLPFX | CLPAX | CLPCX | CLPAX |
|---|---|---|---|---|
| Share Class | Class I | Class A | Class C | Class A w/ Sales Load |
| CUSIP | 62827M532 | 62827L187 | 62827L179 | 62827L187 |
| Inception Date | 2014-06-06T00:00:00 | 2013-12-31T00:00:00 | 2013-12-31T00:00:00 | 2013-12-31T00:00:00 |
| As of Date | 2026-03-11T00:00:00 | 2026-03-11T00:00:00 | 2026-02-27T00:00:00 | 2026-03-11T00:00:00 |
| Daily NAV | 13.69 | 13.39 | 11.97 | 13.39 |
| NAV Change | -0.07 | -0.07 | 0 | -0.07 |
| % NAV Change | -0.51% | -0.52% | 0.00% | -0.52% |
Current Fund Performance
Annualized if greater than a year
| Share Class | 1 Month | 3 Months | 6 Months | YTD | 1 Year | 3 Years | 5 Years | 10 Years | Since Inception |
|---|---|---|---|---|---|---|---|---|---|
| Class I | 0.59% | -4.00% | 2.68% | -0.58% | 19.48% | 17.56% | 6.30% | 6.56% | 5.36% |
| Class A | 0.60% | -4.02% | 2.59% | -0.59% | 19.18% | 17.28% | 6.02% | 6.31% | 5.49% |
| Class C | -3.62% | -4.72% | 3.04% | -1.48% | 12.26% | 15.44% | 5.25% | 5.78% | 4.62% |
| Class A w/ Sales Charge | -5.17% | -9.55% | -3.32% | -6.30% | 12.30% | 15.00% | 4.78% | 5.68% | 4.98% |
Prior to 10/1/2020, the Fund implemented a different strategy.
Quarterly Fund Performance
Annualized if greater than a year
| Share Class | 1 Month | 3 Months | 6 Months | YTD | 1 Year | 3 Years | 5 Years | 10 Years | Since Inception |
|---|---|---|---|---|---|---|---|---|---|
| Class I | -3.93% | 0.38% | 6.29% | 12.68% | 12.68% | 19.69% | 6.25% | 6.15% | 5.50% |
| Class A | -4.01% | 0.32% | 6.11% | 12.37% | 12.37% | 19.39% | 5.98% | 5.90% | 5.63% |
| Class C | -4.05% | 0.12% | 5.75% | 11.57% | 11.57% | 18.46% | 5.19% | 5.09% | 4.81% |
| Class A w/ Sales Charge | -9.51% | -5.43% | 0.04% | 5.89% | 5.89% | 17.04% | 4.73% | 5.28% | 5.11% |
Prior to 10/1/2020, the Fund implemented a different strategy.
The Fund’s maximum sales charge for Class “A” shares is 5.75%. Investments in mutual funds involve risks. Performance is historic and does not guarantee future results. Investment return and principal value will fluctuate with changing market conditions so that when redeemed, shares may be worth more or less than their original cost. Current performance may be lower or higher than the performance data quoted. To obtain the most recent month end performance information or the Fund’s prospectus please call the Fund, toll free at 1-866-447-4228. You can also obtain a prospectus at www.CatalystMF.com.
Fund Expenses
| Share Class | Class I | Class A | Class C | Class A w/ Sales Charge |
|---|---|---|---|---|
| Prospectus Gross Expense Ratio (11/1/2025) | 2.37% | 2.62% | 3.37% | 2.62% |
| Prospectus Net Expense Ratio (11/1/2025) | 1.58% | 1.83% | 2.58% | 1.58% |
| Annual Report Net Expense Ratio (6/30/2025)* | 1.53% | 1.78% | 2.53% | 1.78% |
The advisor has contractually agreed to waive advisory fees and/or reimburse expenses of the Fund to the extent necessary to limit total annual fund operating expenses (excluding brokerage costs; borrowing costs such as (a) interest and (b) dividends on securities sold short; underlying fund expenses; taxes and, extraordinary expenses, such as regulatory inquiry and litigation expenses) at 1.74%, 2.49% and 1.49% for Class A shares, Class C shares and Class I shares, respectively, through October 31, 2026.


