The Fund seeks to achieve its investment objective by investing in a series of put and call options on exchange traded funds (“ETFs”) that track the S&P 500 Index and in fixed income securities.
Fund Details
As of 2026-02-27T00:00:00
| Ticker | SHIIX |
| NAV | 10.99 |
| NAV Change | -0.01 |
| % NAV Change | -0.09% |
| YTD Return | 1.01% |
| Distribution Frequency | Annually |
| Ticker | SHIEX |
| NAV | 10.9 |
| NAV Change | -0.01 |
| % NAV Change | -0.09% |
| YTD Return | 0.93% |
| Distribution Frequency | Annually |
| Ticker | SHINX |
| NAV | 10.56 |
| NAV Change | -0.01 |
| % NAV Change | -0.09% |
| YTD Return | 0.86% |
| Distribution Frequency | Annually |
Fund Documents
Supplemental Documents
Financial Professional Documents
Fund Objective
The Fund seeks capital appreciation.
Initial
Strategy seeks to limit downside losses to 12.5% while participating on the upside of the S&P 500 up to approximately 15%.
Rebalance
As the market increases, the strategy seeks to increase the downside hedge and upside participation.
Optimize
The strategy seeks to optimize its level of risk and reward, thus converting a hard cap1 to a soft cap.2
1Outcome that cannot dynamically adjust to market conditions
2Adjusts to market conditions providing potential benefits such as increased longterm upside participation
Investment Strategy
Each series consists of (1) a downside put spread which serves to limit downside risk, providing a tail hedge, and (2) an upside call spread which assists in financing the mitigation and results in a cap on the upside.
The investment strategy is implemented through a rolling laddered portfolio.
The portfolio is then regularly optimized based on market activity to maintain a consistent tail-risk hedge and upside participation.
Defined Outcome Profile
The charts below illustrates the Fund’s approach in seeking to limit losses when the S&P 500 Index declines through the purchase of downside puts creating a target floor.
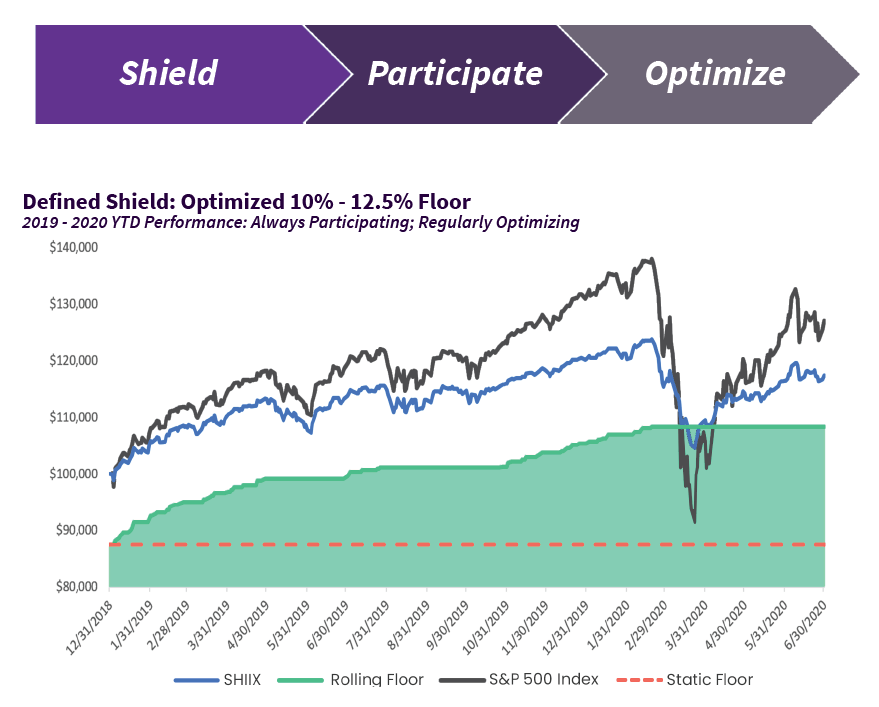
- Based on S&P 500
- 10% – 12.5% annual floor
- 60% – 75% market participation
- Always optimized, always relevant
- Daily liquidity; no paperwork; easy model implementation
By continuously stepping up our hedge, the strategy is always relevant, providing the same characteristics as day one – an important element in always matching the clients initial risk/reward needs.
Fund Management
Investment Advisor: Catalyst Capital Advisors, LLC
Sub-Advisor: Exceed Advisory, LLC
Joseph Halpern | Portfolio Manager
- Founding Partner of Exceed Investments, LLC
- BS in Finance & Accounting, New York University Stern School of Business
Fund Overview
| Ticker | SHIIX | SHIEX | SHINX | SHIEX |
|---|---|---|---|---|
| Share Class | Class I | Class A | Class C | Class A w/ Sales Load |
| CUSIP | 62827P626 | 62827P642 | 62827P634 | 62827P642 |
| Inception Date | 2015-04-14T00:00:00 | 2015-04-14T00:00:00 | 2017-09-05T00:00:00 | 2015-04-14T00:00:00 |
| As of Date | 2026-02-27T00:00:00 | 2026-02-27T00:00:00 | 2026-02-27T00:00:00 | 2026-02-27T00:00:00 |
| Daily NAV | 10.99 | 10.9 | 10.56 | 10.9 |
| NAV Change | -0.01 | -0.01 | -0.01 | -0.01 |
| % NAV Change | -0.09% | -0.09% | -0.09% | -0.09% |
Current Fund Performance
Annualized if greater than a year
| Share Class | 1 Month | 3 Months | 6 Months | YTD | 1 Year | 3 Years | 5 Years | 10 Years | Since Inception |
|---|---|---|---|---|---|---|---|---|---|
| Class I | 0.18% | 1.83% | 4.37% | 1.01% | 11.02% | 12.79% | 6.19% | 7.66% | 6.34% |
| Class A | 0.18% | 1.77% | 4.13% | 0.93% | 10.72% | 12.48% | 5.92% | 7.39% | 6.07% |
| Class C | 0.09% | 1.57% | 3.82% | 0.86% | 9.97% | 11.67% | 5.13% | N/A | 5.82% |
| Class A w/ Sales Charge | -5.55% | -4.07% | -1.88% | -4.89% | 4.33% | 10.30% | 4.67% | 6.75% | 5.49% |
Quarterly Fund Performance
Annualized if greater than a year
| Share Class | 1 Month | 3 Months | 6 Months | YTD | 1 Year | 3 Years | 5 Years | 10 Years | Since Inception |
|---|---|---|---|---|---|---|---|---|---|
| Class I | 0.63% | 2.10% | 6.26% | 10.88% | 10.88% | 12.82% | 6.08% | 7.07% | 6.33% |
| Class A | 0.65% | 2.04% | 6.14% | 10.58% | 10.58% | 12.54% | 5.81% | 6.82% | 6.07% |
| Class C | 0.52% | 1.76% | 5.69% | 9.70% | 9.70% | 11.68% | 5.02% | N/A | 5.82% |
| Class A w/ Sales Charge | -5.11% | -3.79% | 0.02% | 4.24% | 4.24% | 10.34% | 4.57% | 6.19% | 5.48% |
The Fund’s maximum sales charge for Class “A” shares is 5.75%. Investments in mutual funds involve risks. Performance is historic and does not guarantee future results. Investment return and principal value will fluctuate with changing market conditions so that when redeemed, shares may be worth more or less than their original cost. Current performance may be lower or higher than the performance data quoted. To obtain the most recent month end performance information or the Fund’s prospectus please call the Fund, toll free at 1-866-447-4228. You can also obtain a prospectus at www.CatalystMF.com.
Fund Expenses
| Share Class | Class I | Class A | Class C | Class A w/ Sales Charge |
|---|---|---|---|---|
| Prospectus Gross Expense Ratio (11/1/2025) | 2.21% | 2.46% | 3.21% | 2.46% |
| Prospectus Net Expense Ratio (11/1/2025) | 1.35% | 1.60% | 2.35% | 1.60% |
| Annual Report Net Expense Ratio (6/30/2025)* | 1.28% | 1.53% | 2.28% | 1.53% |
*The annual report presents the audited actual expenses of the fund for the fiscal year. It excludes the impact of certain items that are listed as prospectus expenses, such as acquired fund fees and expenses.
The advisor has contractually agreed to waive advisory fees and/or reimburse expenses of the Fund to the extent necessary to limit total annual fund operating expenses (excluding brokerage costs; borrowing costs such as (a) interest and (b) dividends on securities sold short; taxes; underlying fund expenses and, extraordinary expenses, such as regulatory inquiry and litigation expenses) at 1.48%, 2.23% and 1.23% for Class A shares, Class C shares and Class I shares, respectively, through October 31, 2026.


